Methodology
The Clark Center Forum uses the following reporting conventions when tabulating the results of its polls of US and European experts in economics and finance. The unweighted graphs reflect the percentages of all the members of a given panel, which means that those who do not answer are in the denominator for that calculation, alongside those who vote on the range from ‘strongly agree’ to ‘strongly disagree’ or who say they have no opinion.
For the weighted graphs, each response is weighted by the level of confidence in the topic that the panelist associates with their answer (on a range from 1 to 10, with 10 being the highest level), divided by the total level of confidence reported by all responding panelists. In this case, those who do not answer are omitted from the calculation.
Please note that from September 2022, the language in our polls will use just two modifiers to refer to the size of an effect:
- ‘Substantial’: when an effect is large enough that it would make a difference that matters for the behavior involved.
- ‘Measurable’: when the direction of the effect is clear, but perhaps experts would differ as to whether it is substantial.
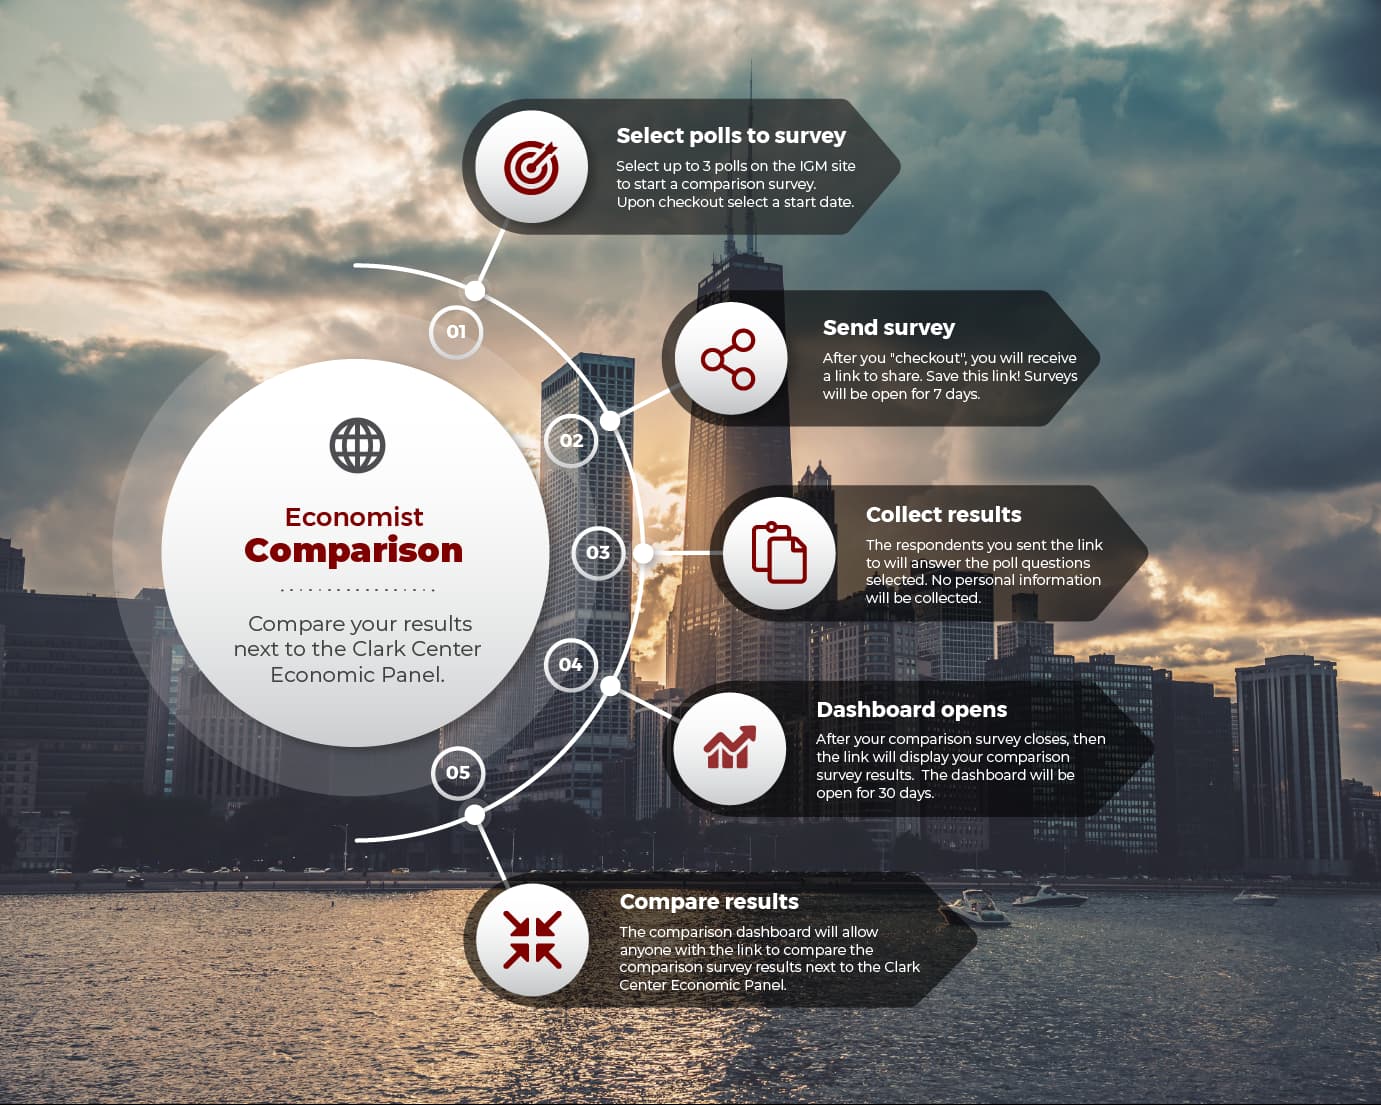
Compare yourself or your peers to the Clark Center Economics Experts Panel